fish maps
The map below uses GBIF museum records downloaded for all ray-finned fishes.
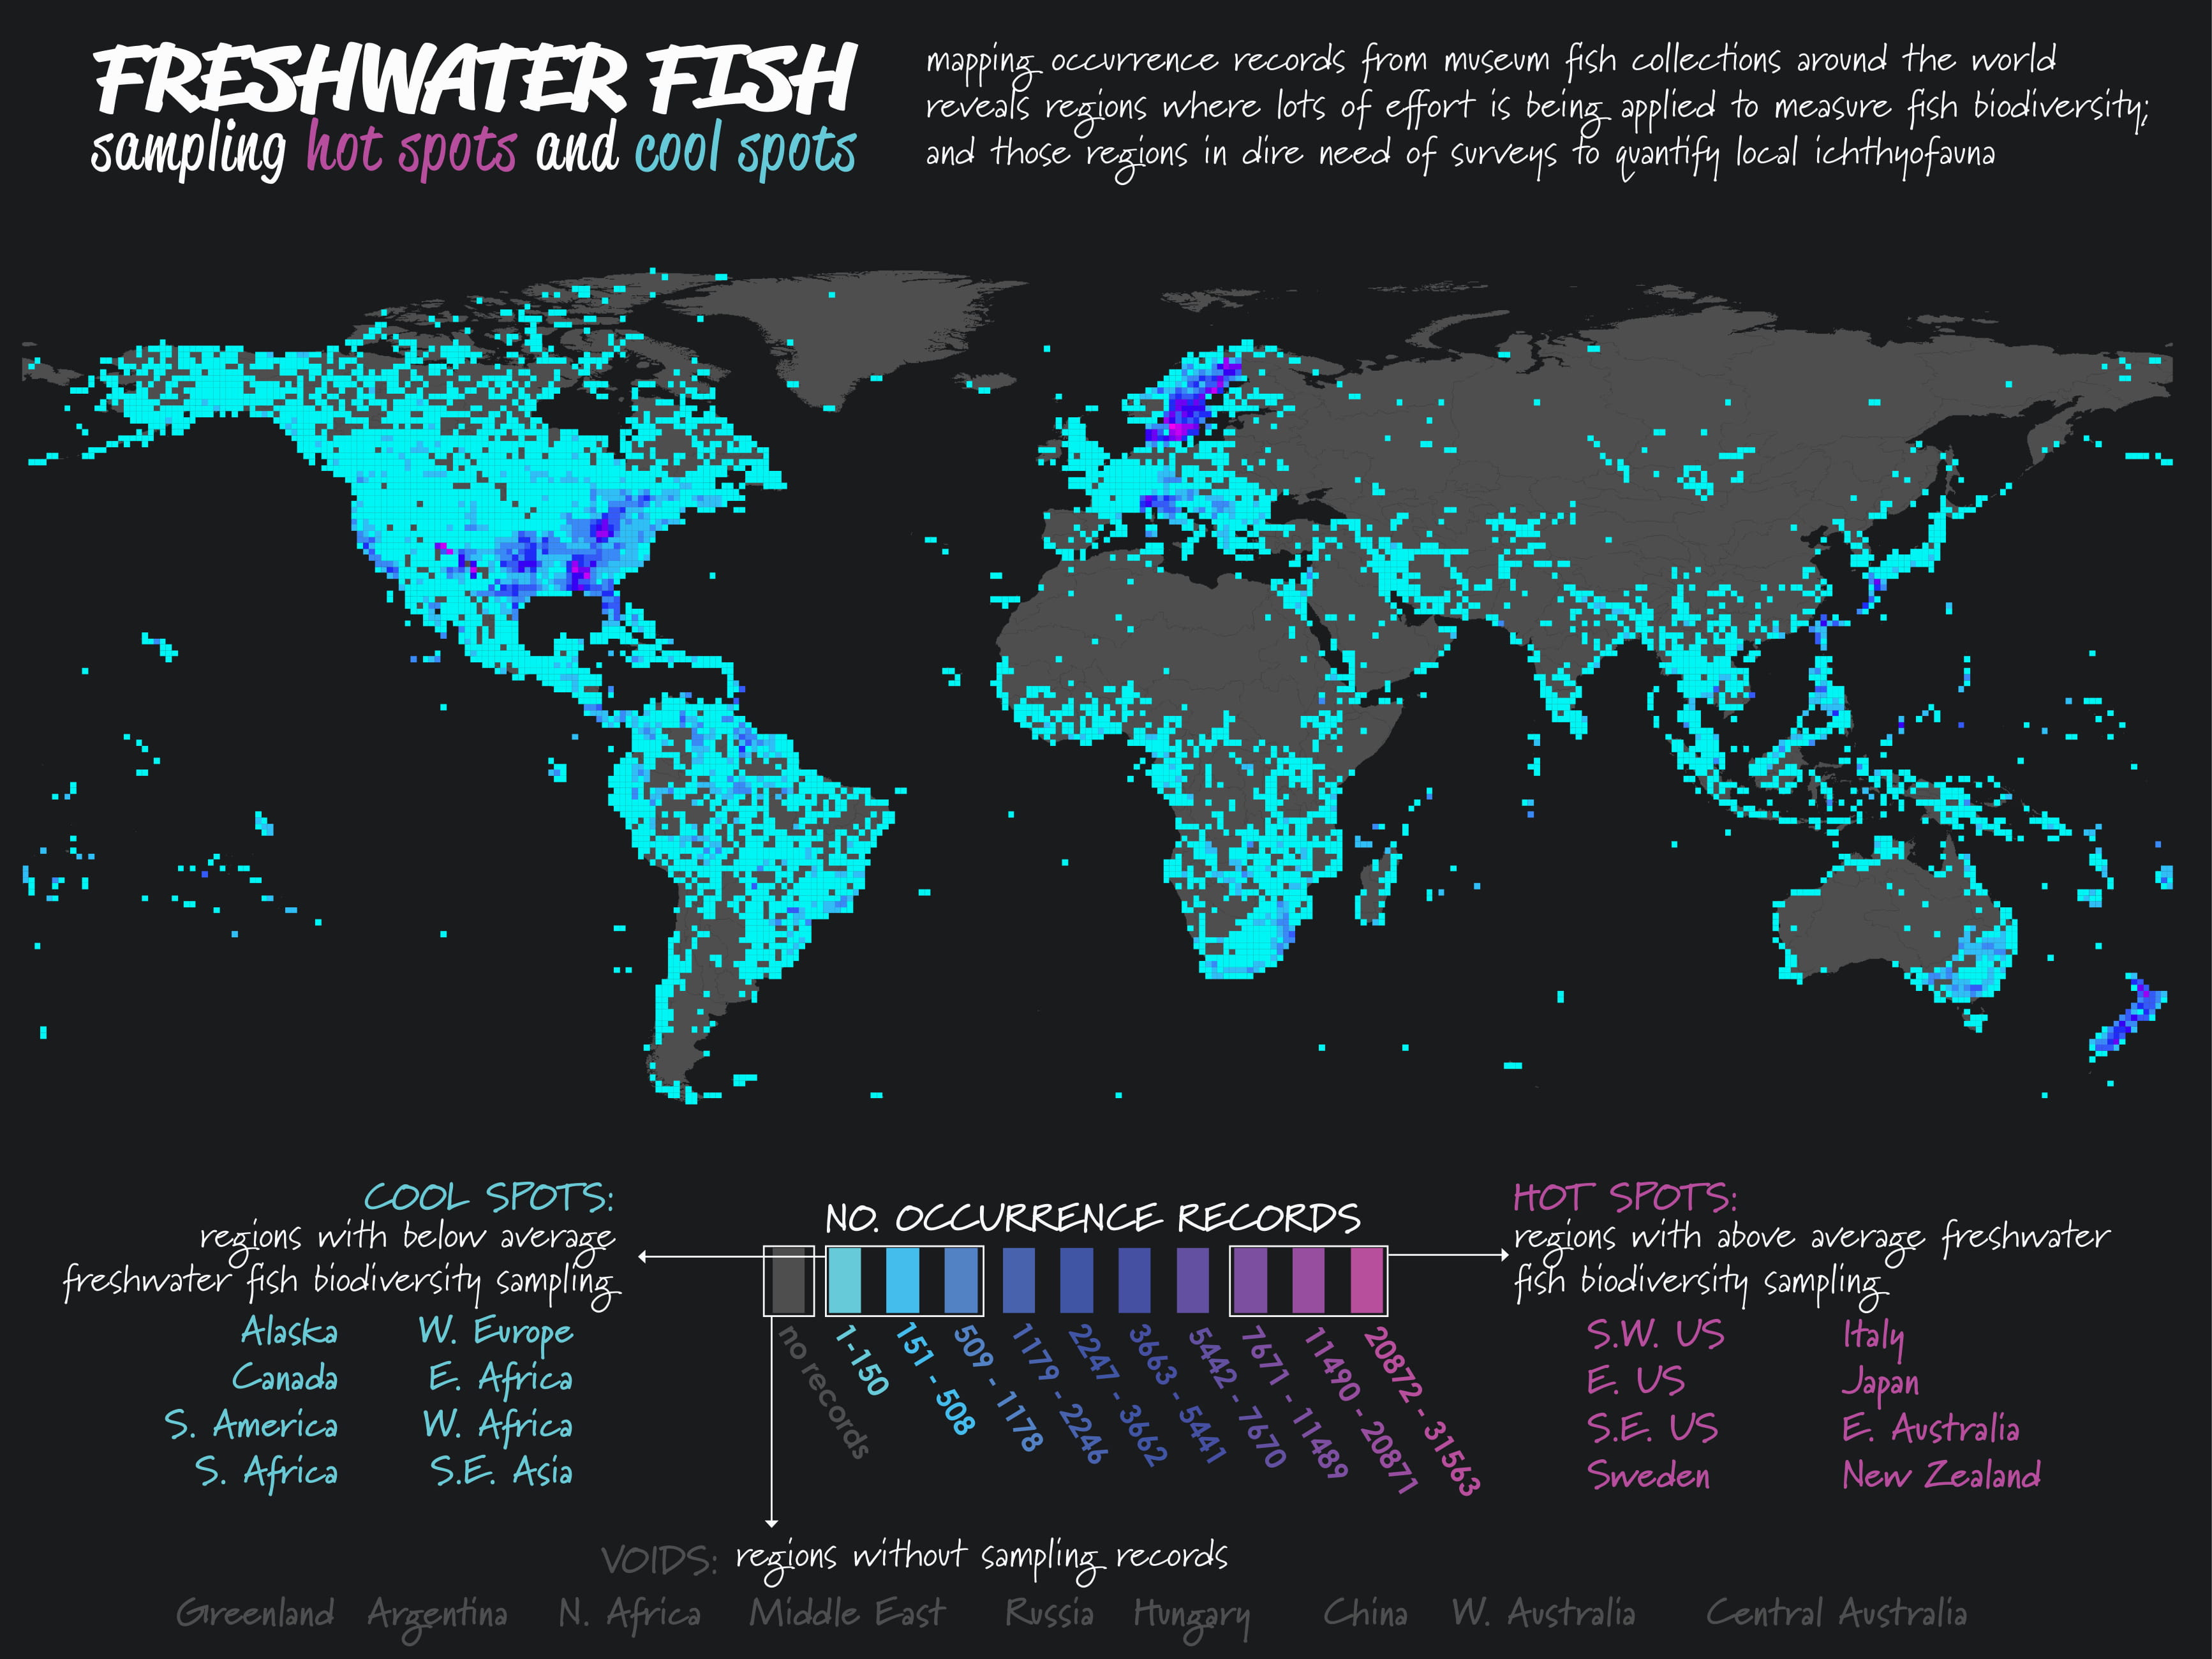 This map shows the number of occurrence records aggregated into grid cells, globally. The maps reveal sampling biases in the number of museum specimens, with sampling hotspots in tempreate countries (US, Europe, and New Zealand). Download here.
The maps below use the IchthyMaps dataset to visualize patterns in US fish community and sampling.
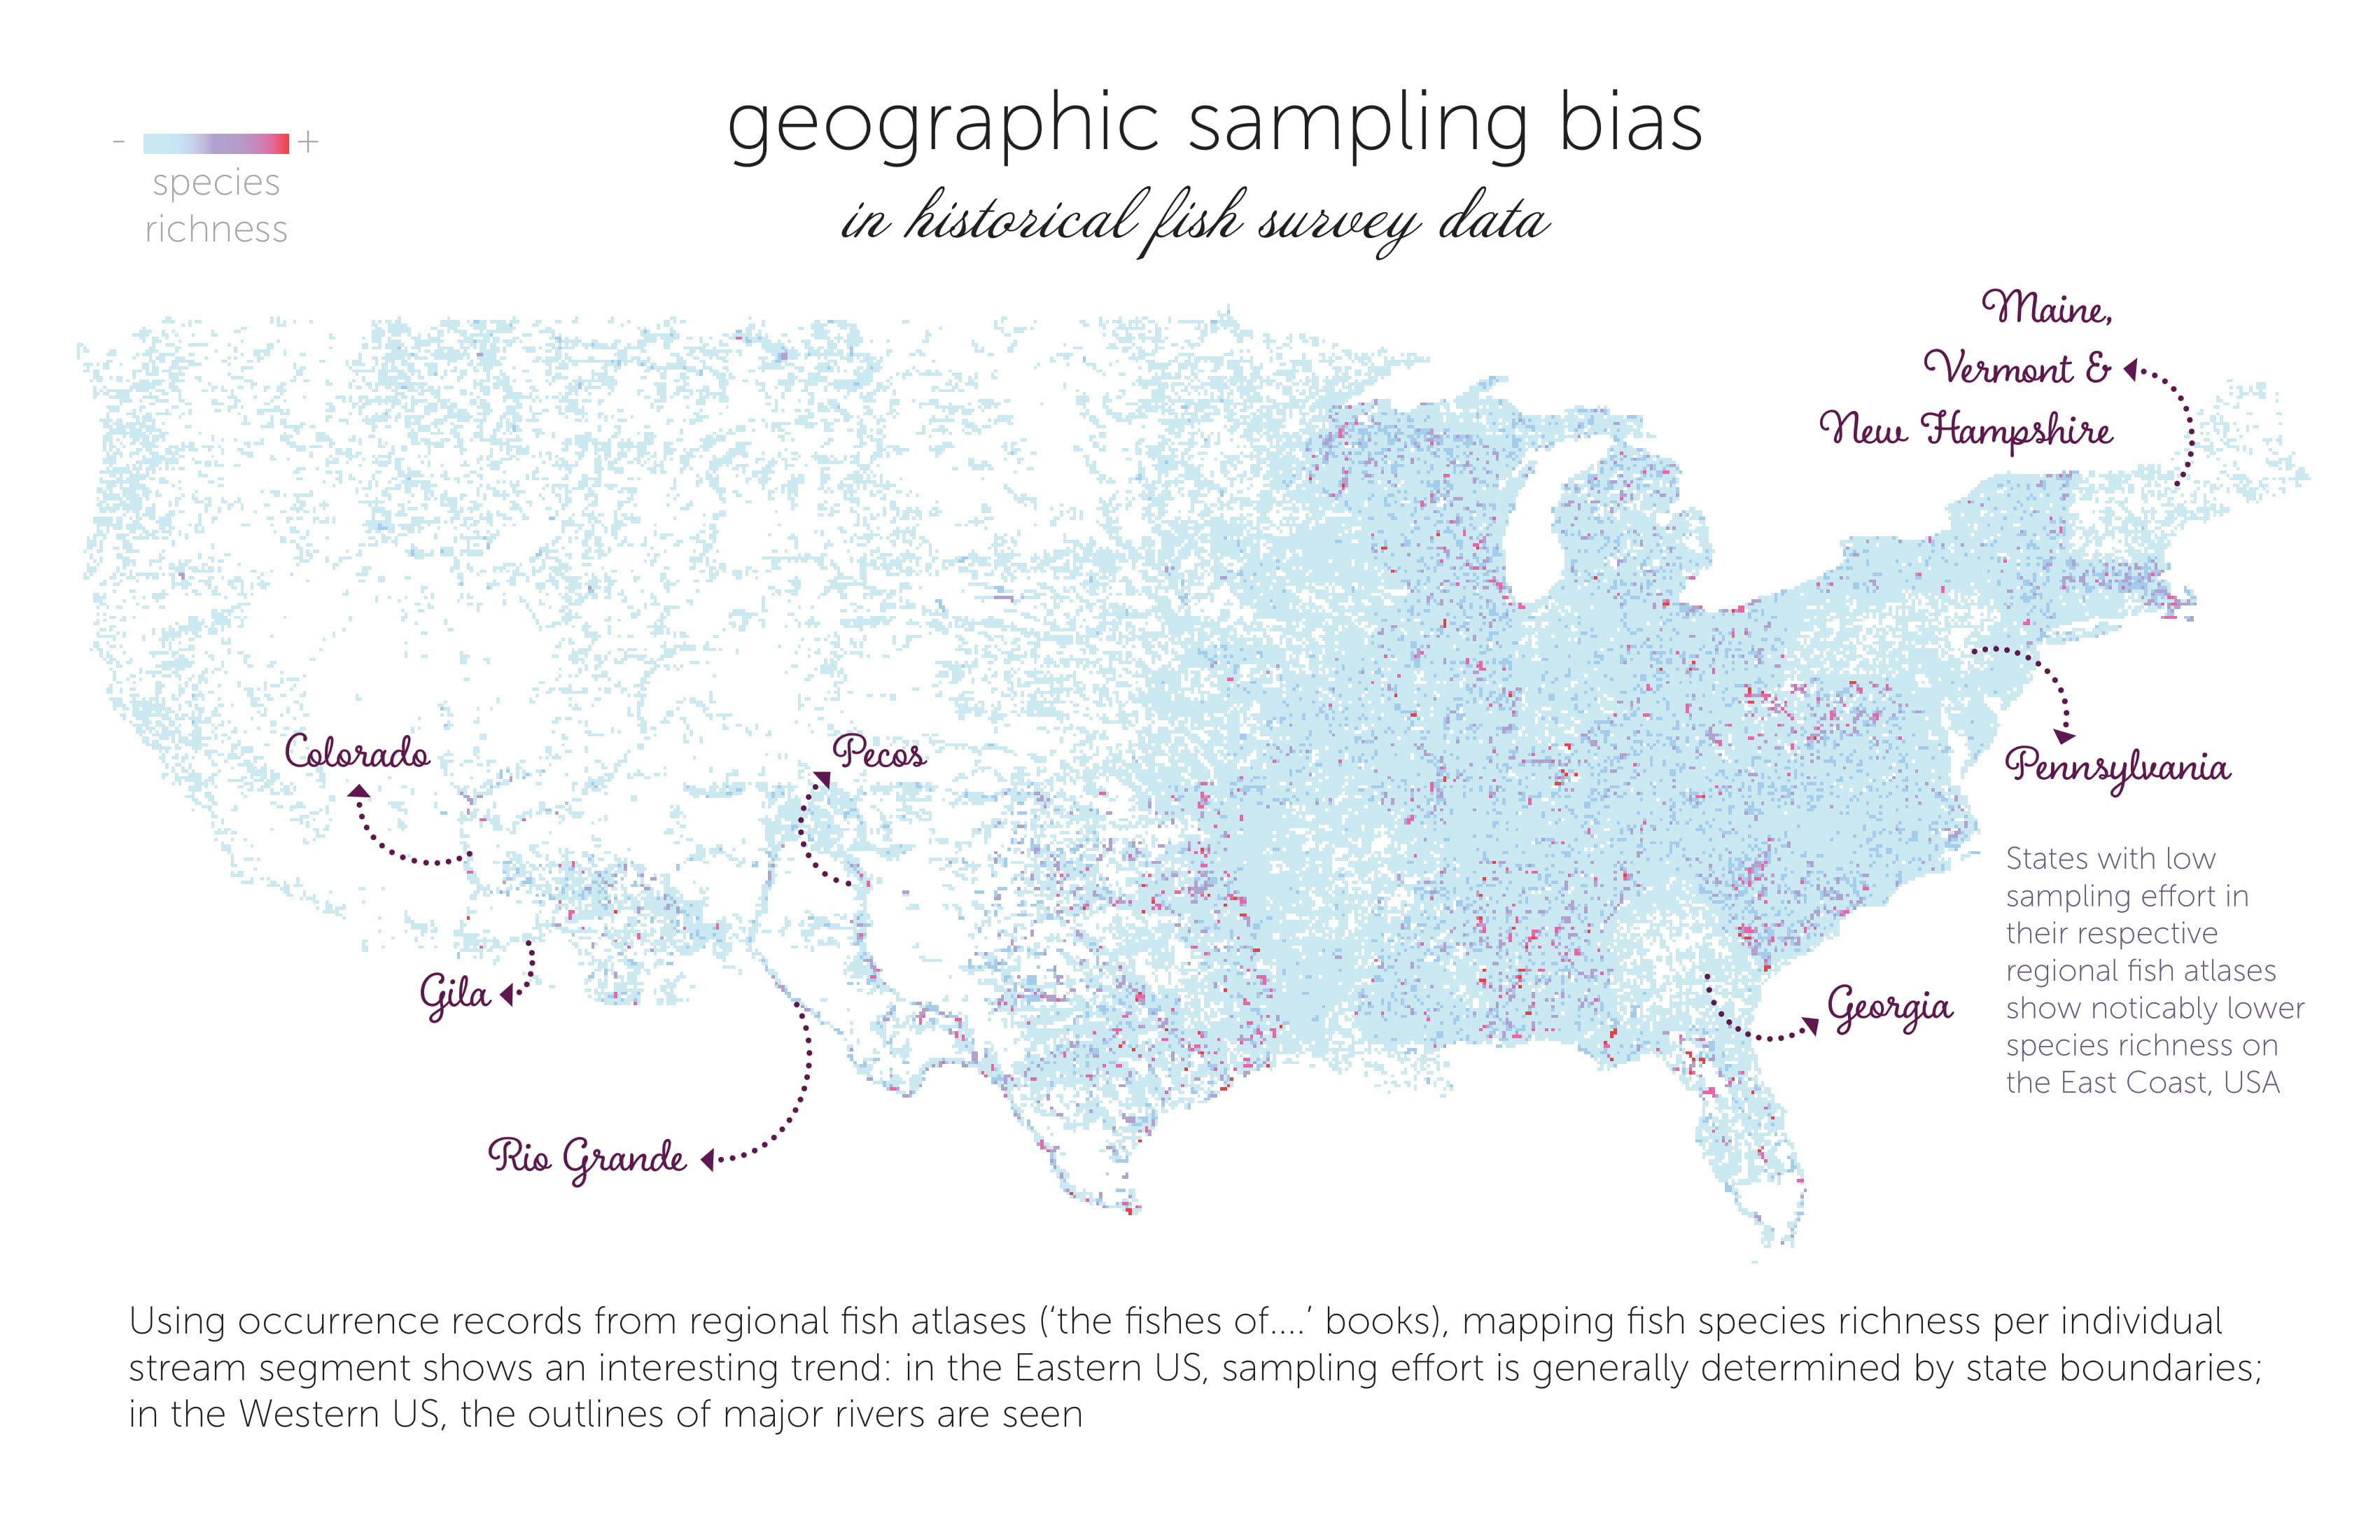 This map shows the species richness calculated at the stream segment scale from historical fish atlas data. The biodiversity trends visualized deviate those that would be expected from the true distribution of species richness, revealing the presence of geographic sampling biases. Download here.
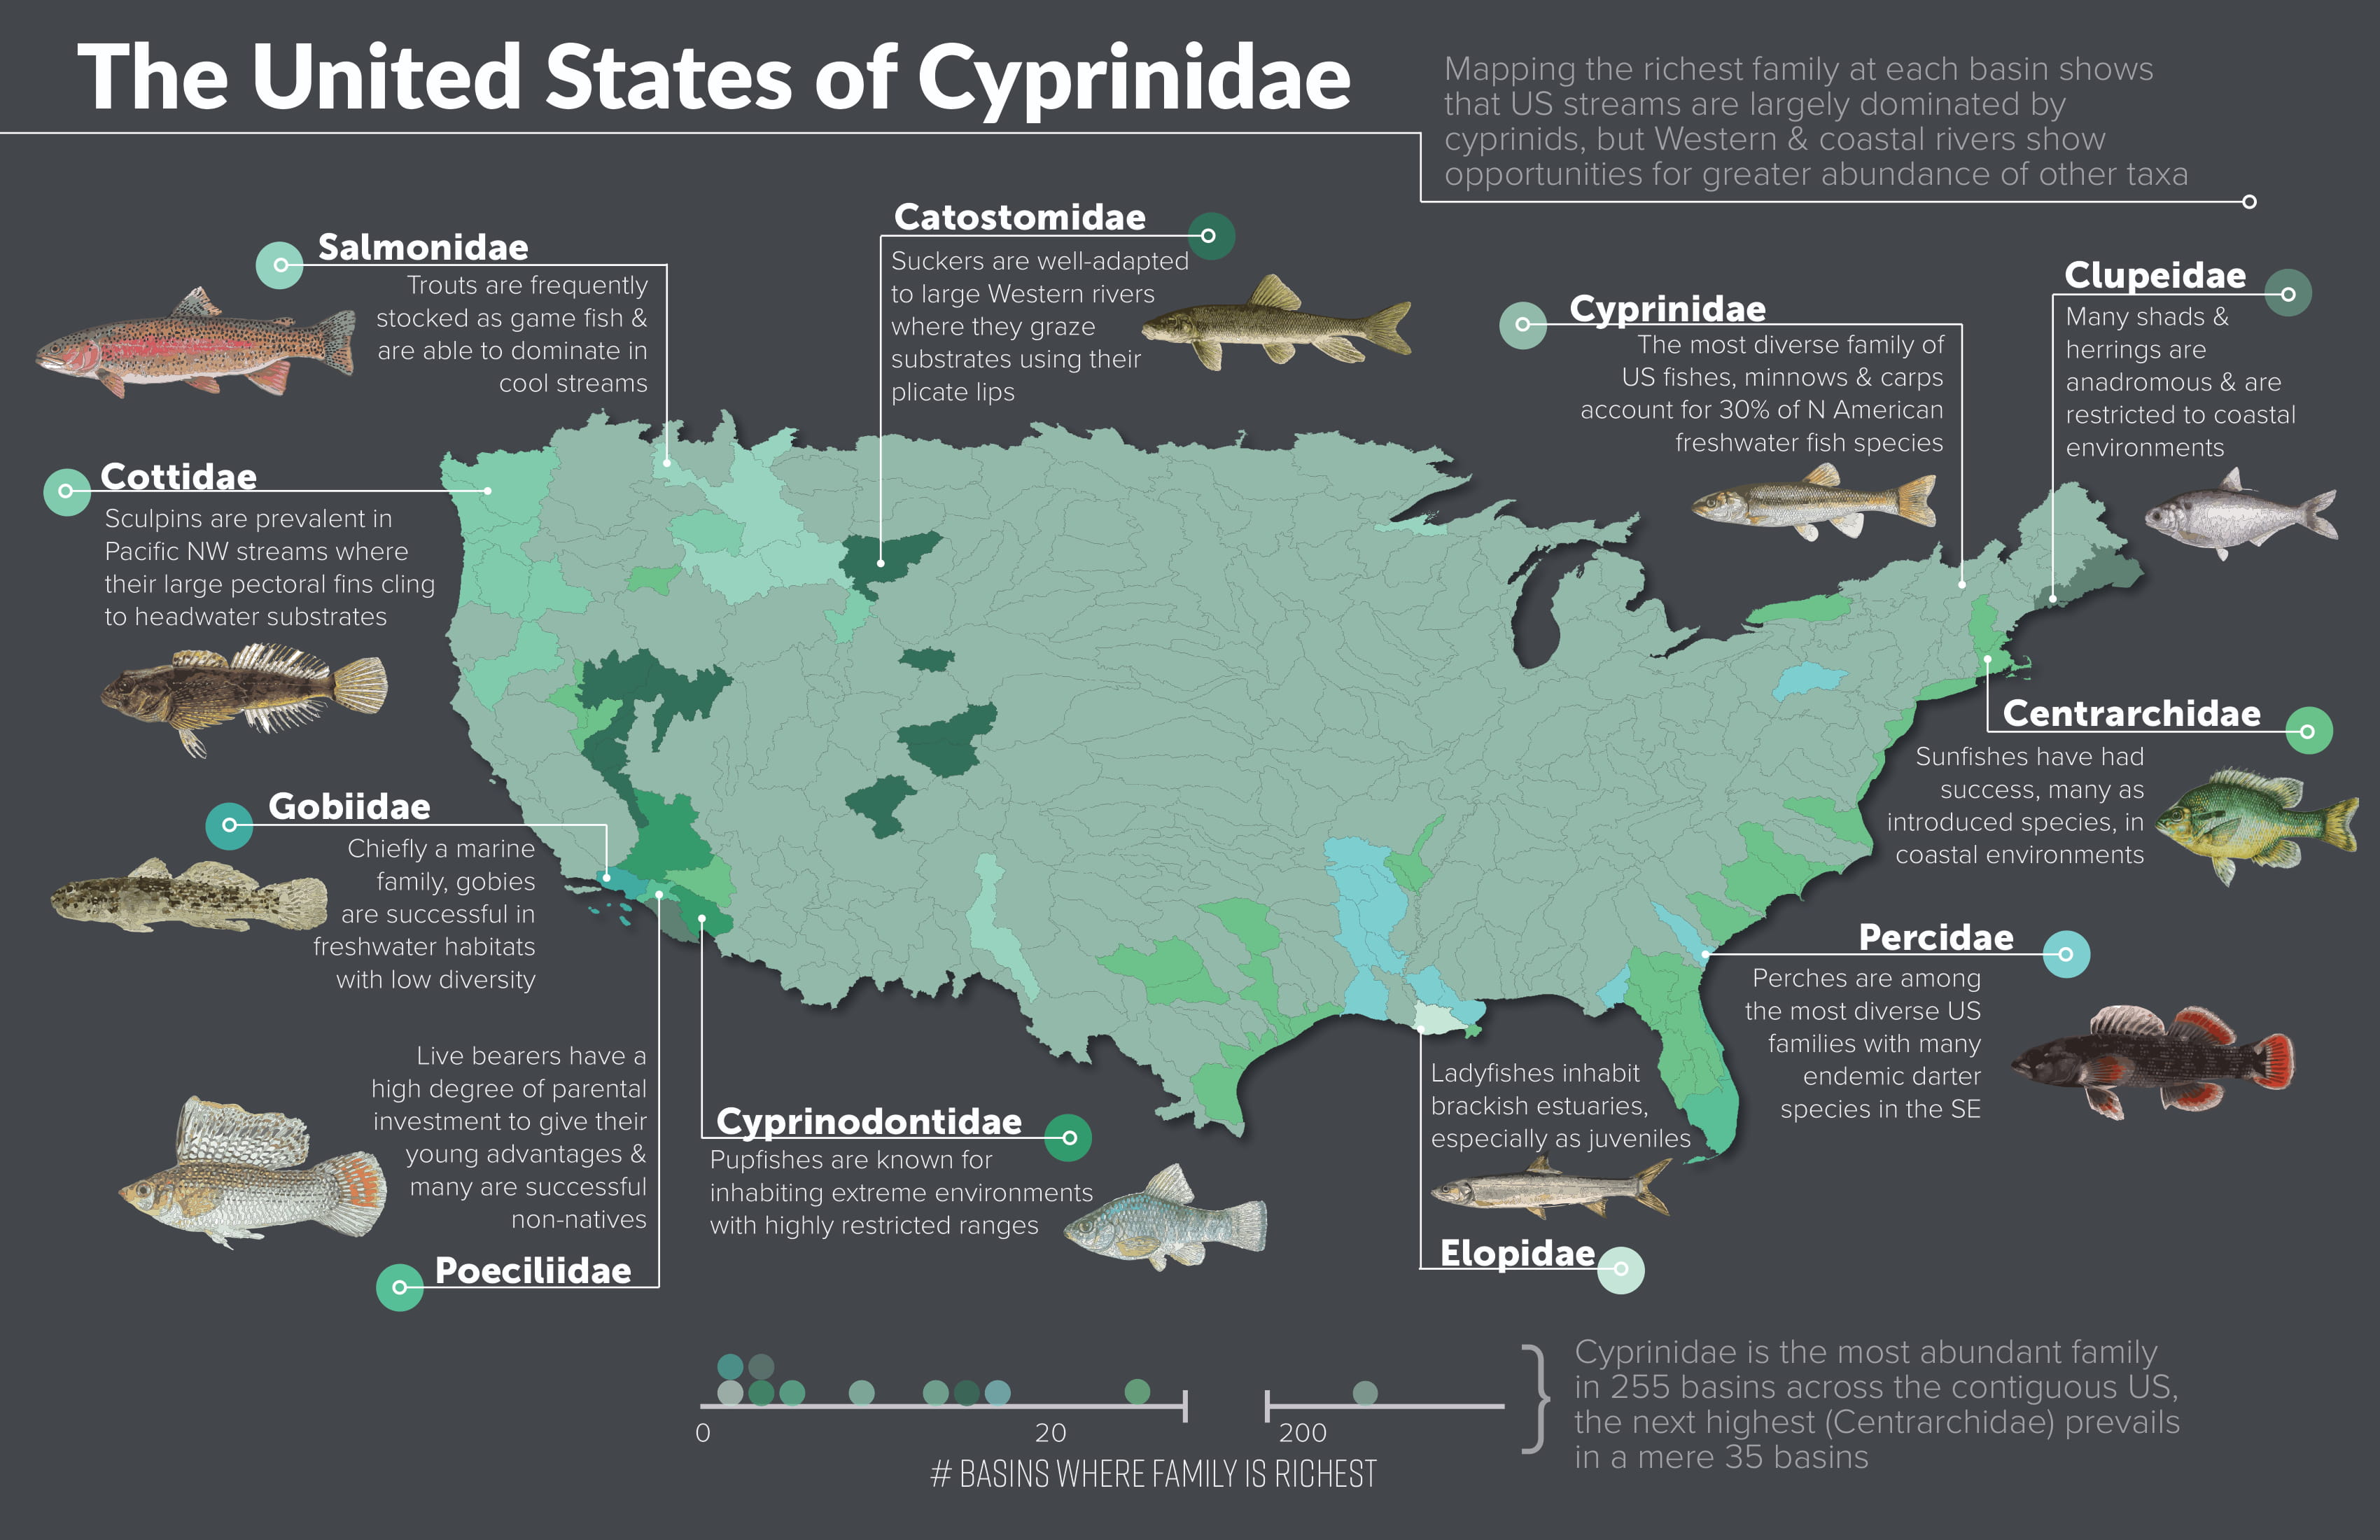 This map indicates the most speciose family in each US river basin. Here, the Cyprinidae are often the richest family at the basin scale, indicating the diversity of this family in the US. Download here.
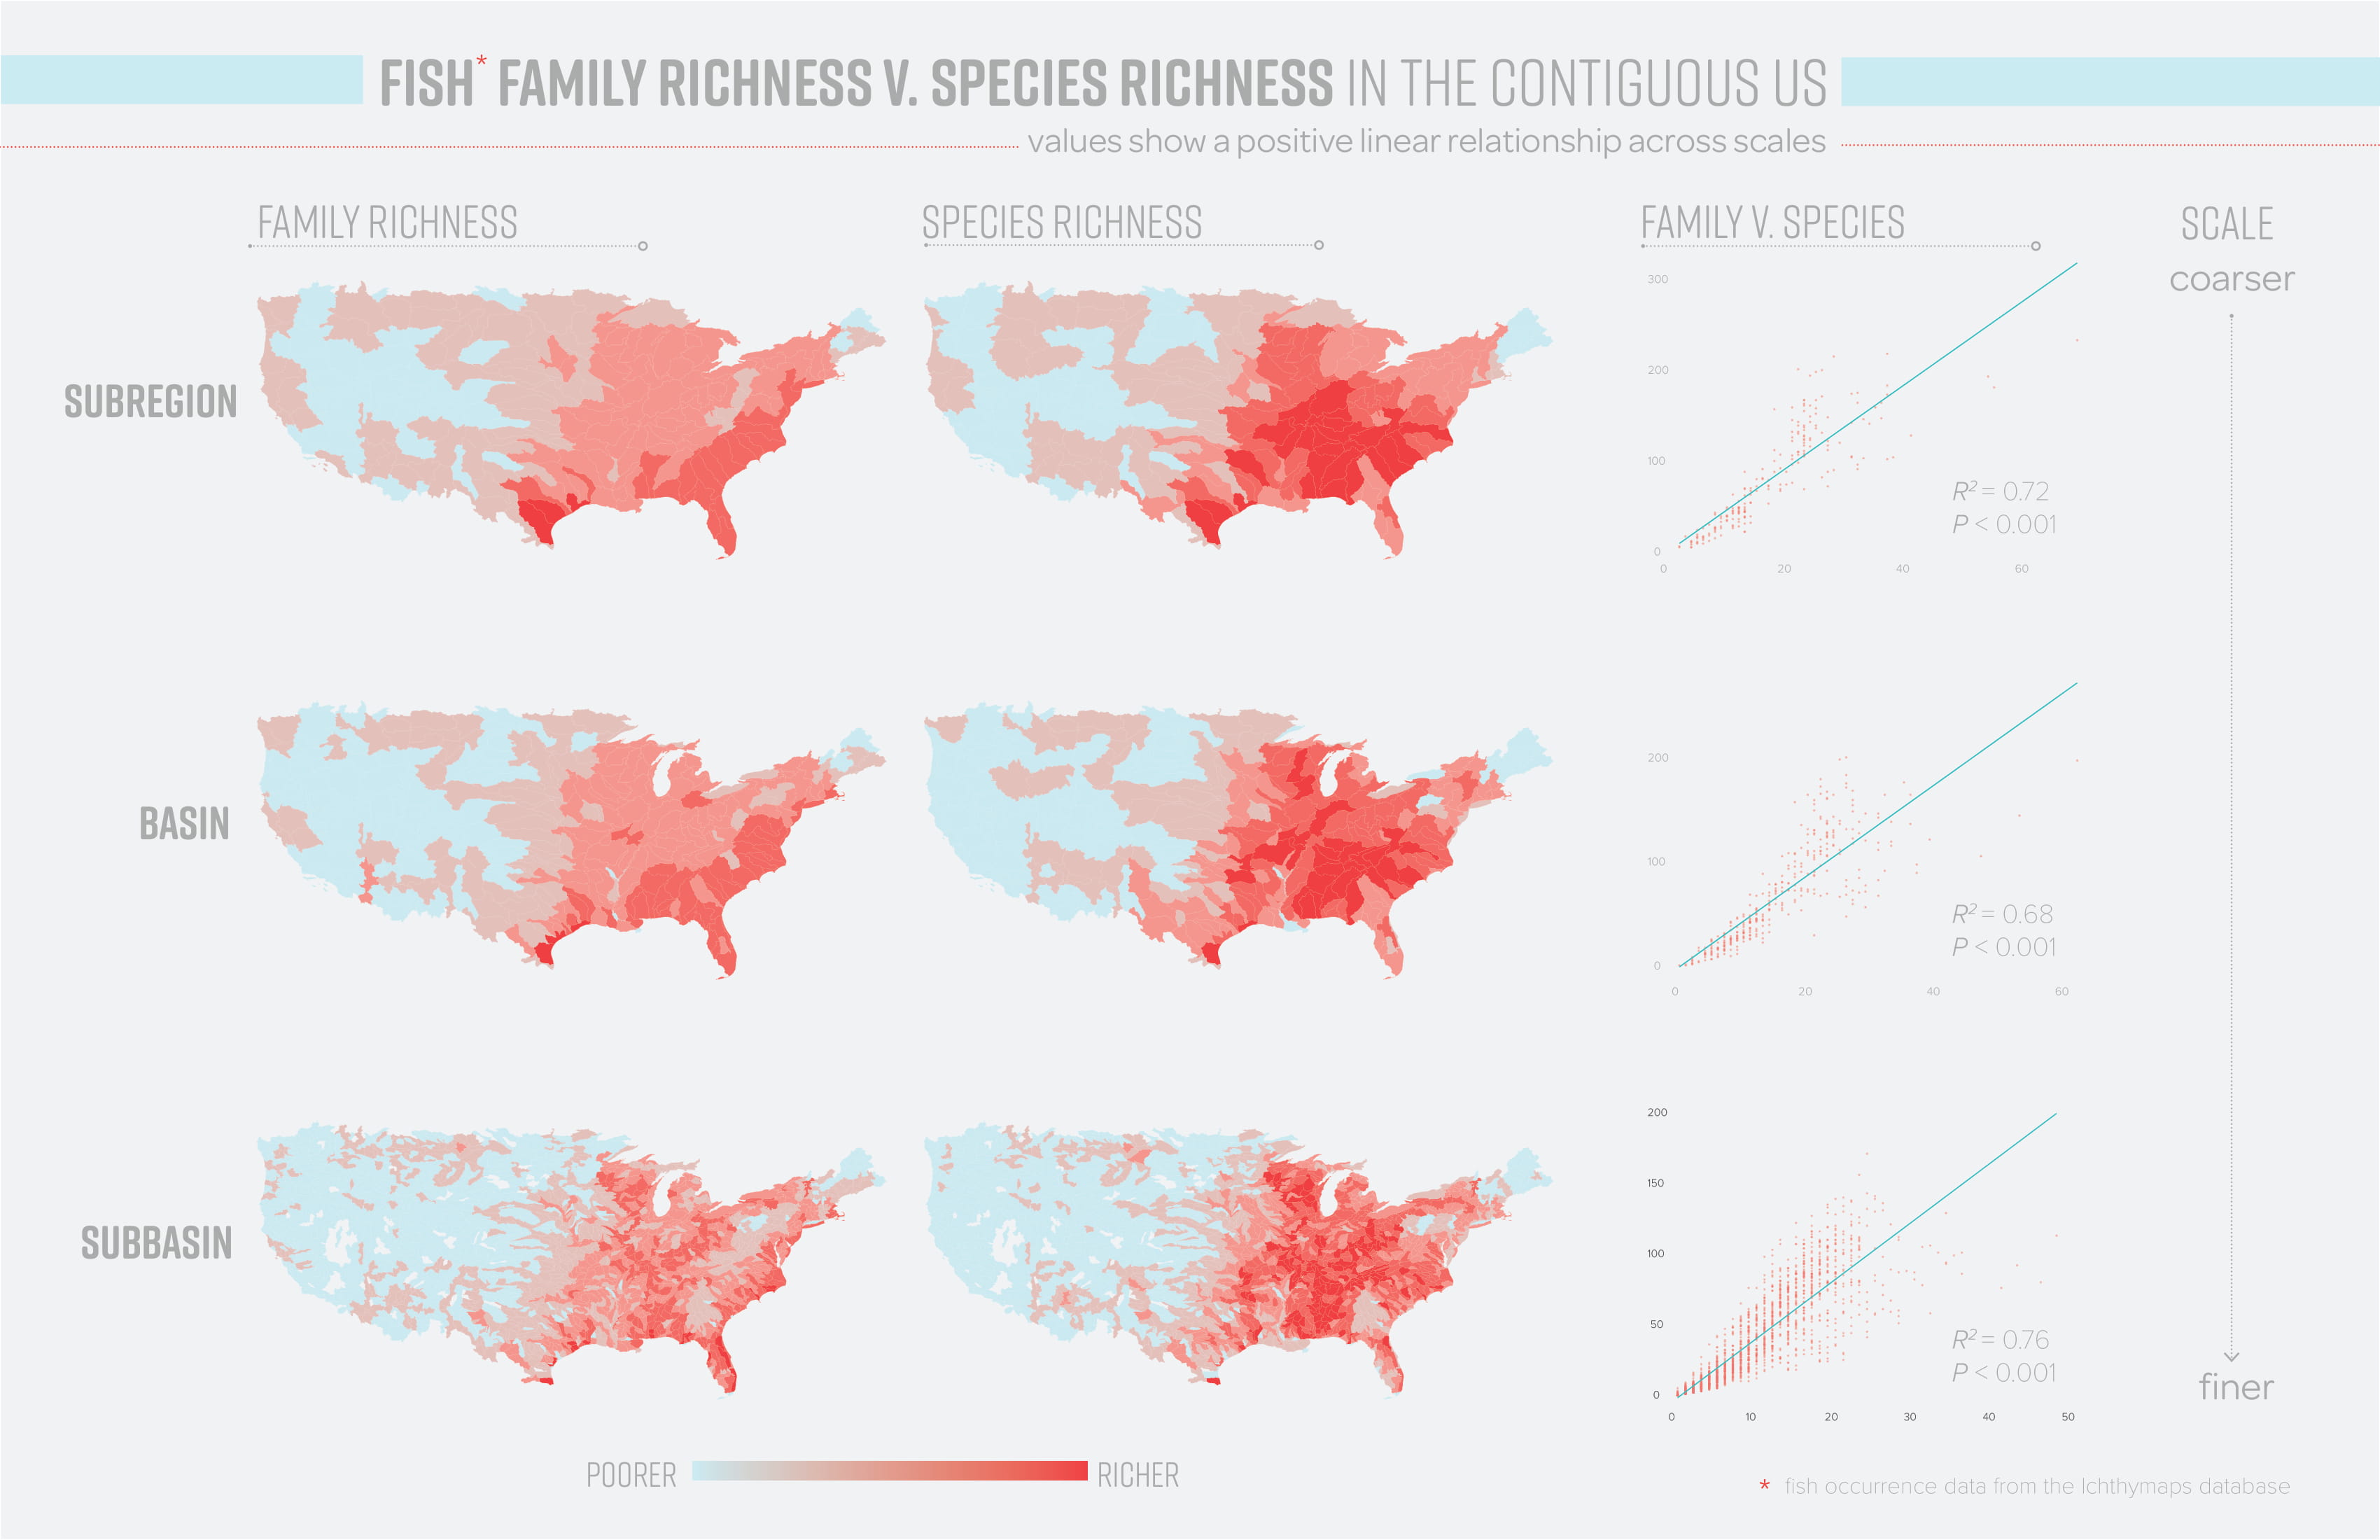 These maps plot the relationship between species richness and family richness across spatial scales in the US. Species richness is highest in the southeastern US and family richness is generally higher near coastlines. Download here.