national park biodiversity
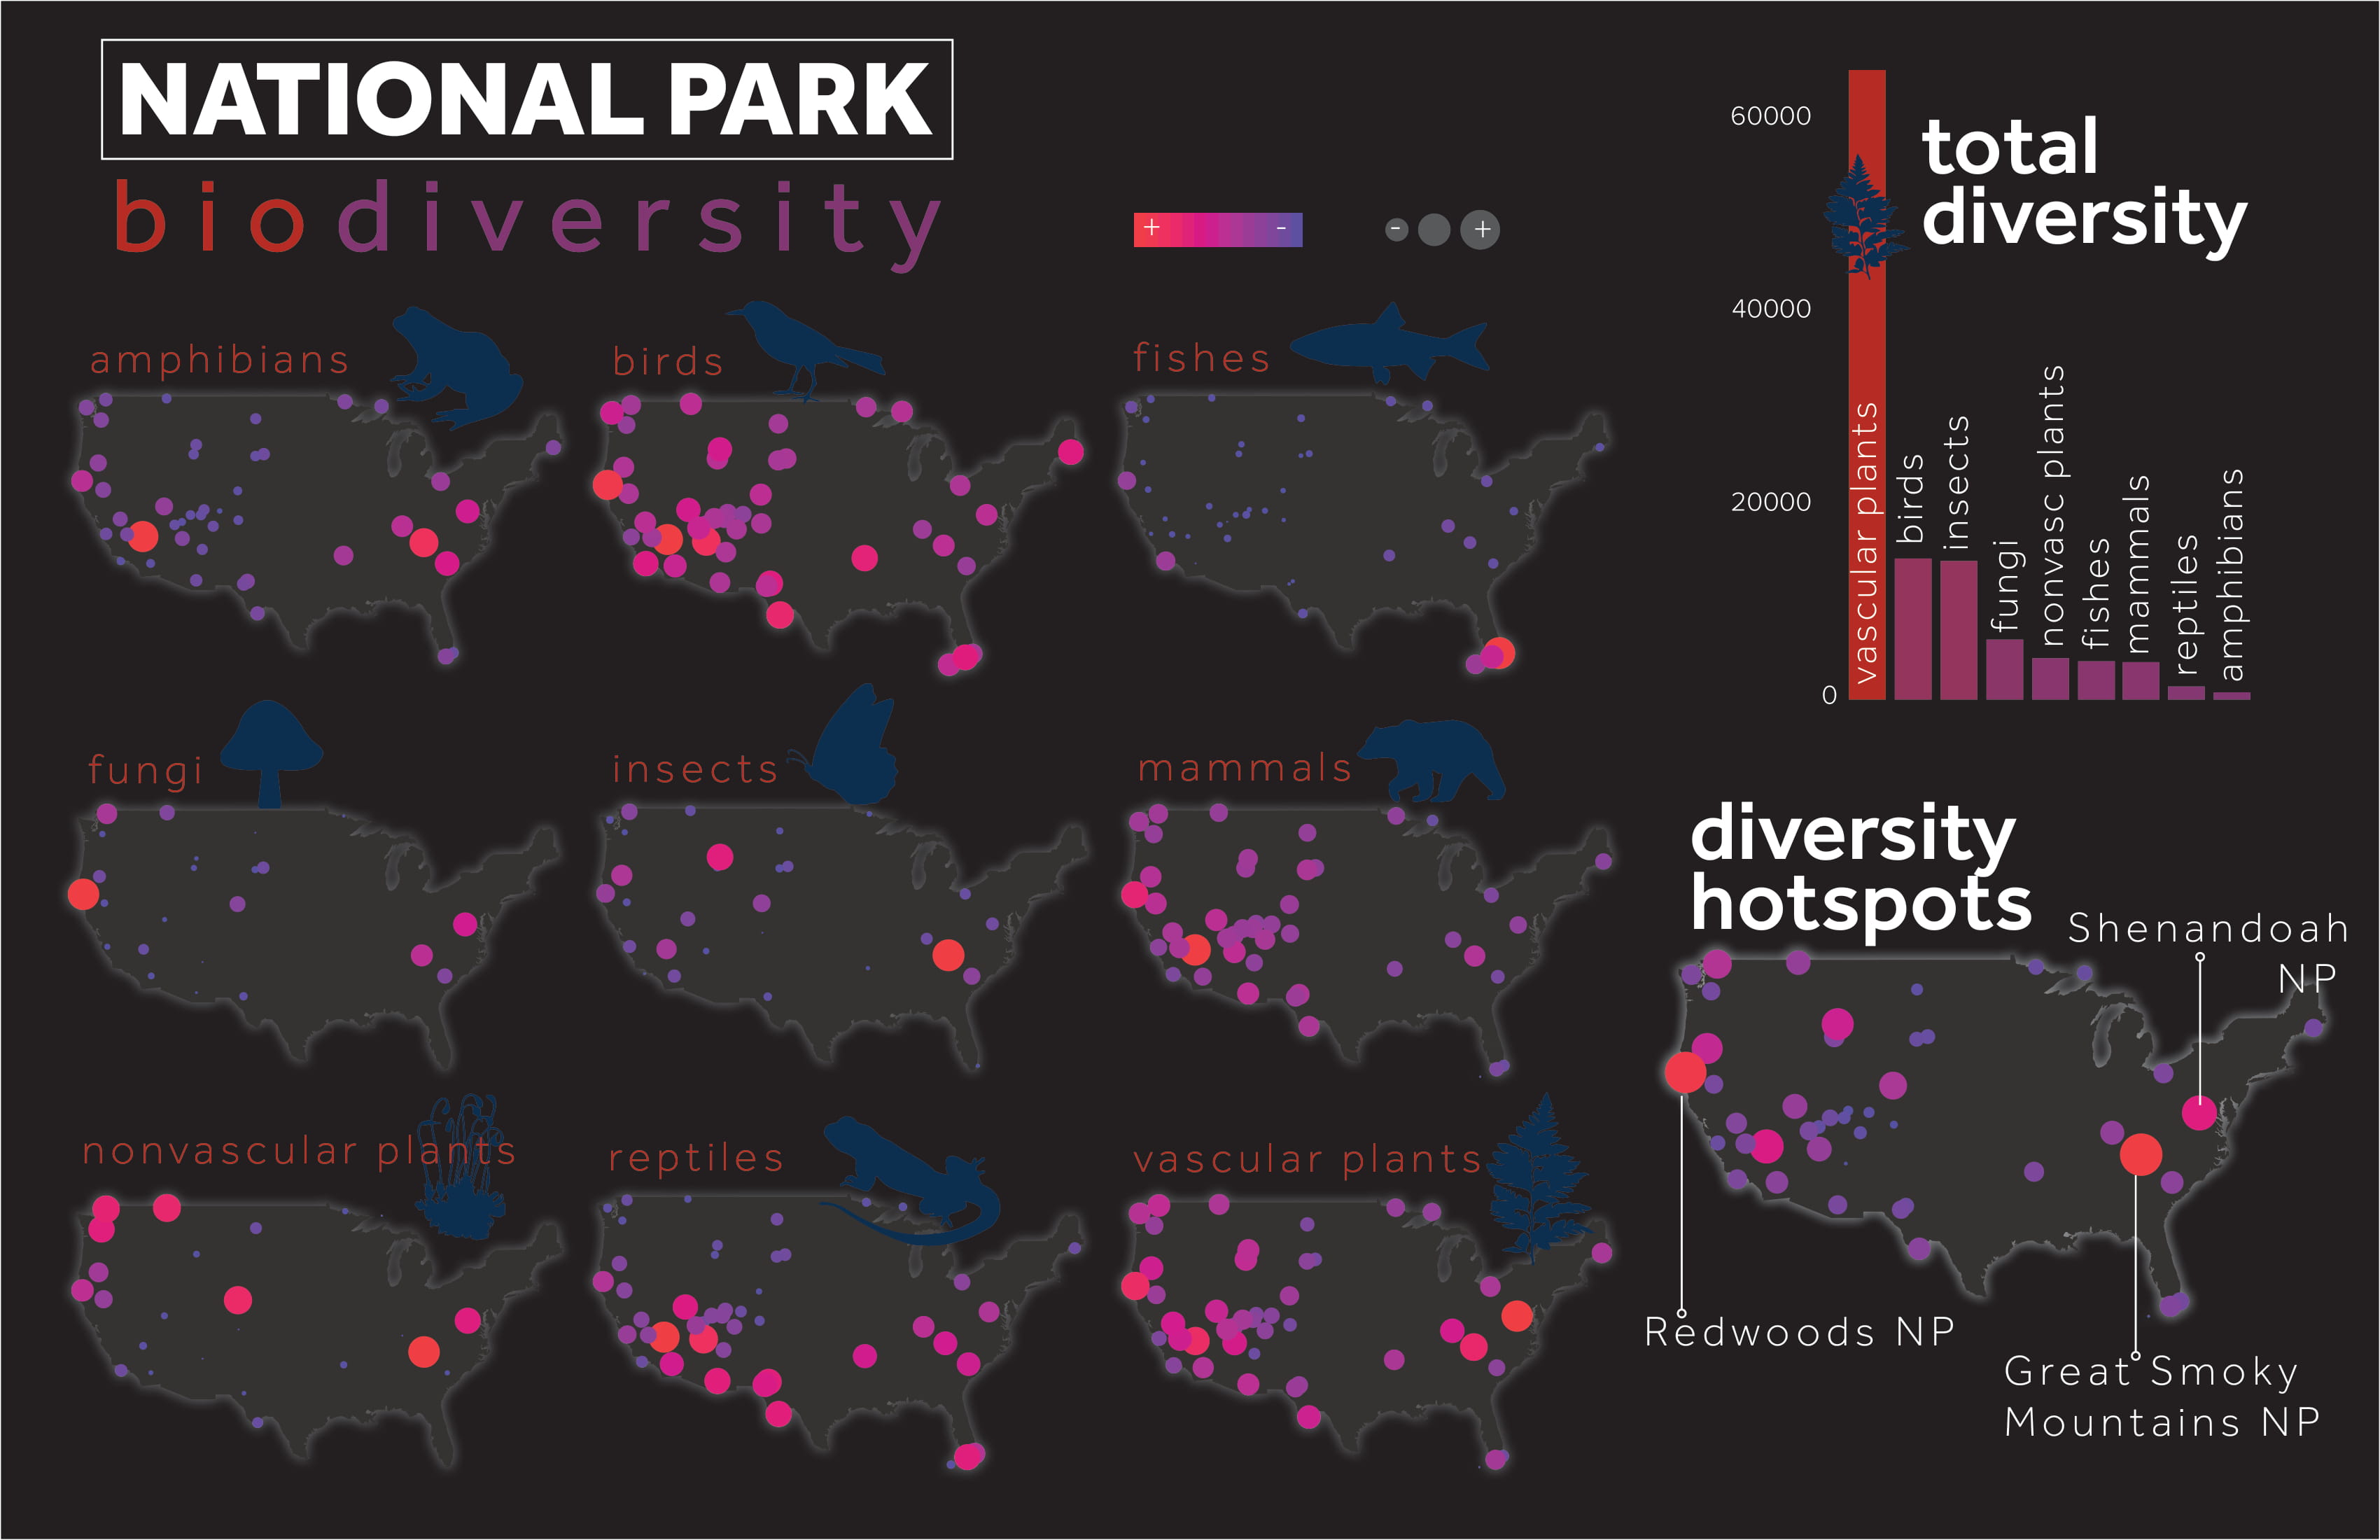 This infographic applies the use of small multiples to show the biodiversity in each US national park, for different taxa. For each map, the color and size schemes illustrate the species richness of each taxa. The map in the bottom right shows the biodiversity for each park, for all taxa combined. The bar chart in the upper right shows the biodiversity of each taxa, among parks. Download here.